
Hi Friend,
I’m a Washington, DC-based data visualization and analytics specialist. I am passionate about bringing data to life through engaging, impactful, and accessible visualizations. This site serves as a portfolio to showcase my work and connect with the data viz community!
My Recent Projects
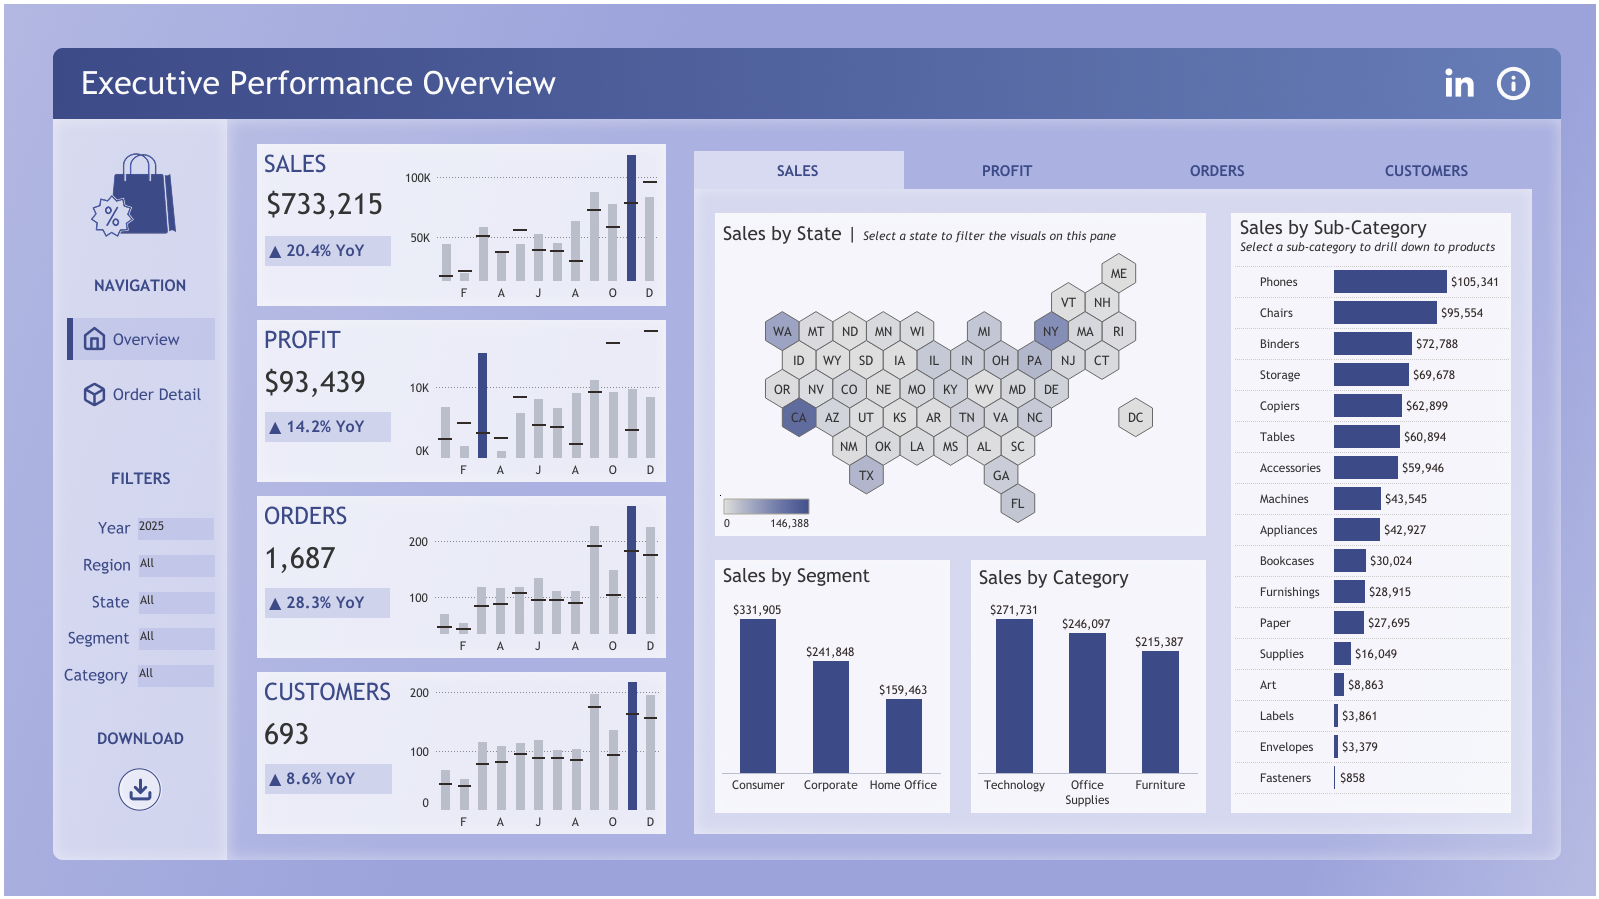
Superstore Performance Dashboard
This executive-level dashboard brings together KPIs, regional performance, and product insights to provide a clear snapshot of performance for a fictional business.
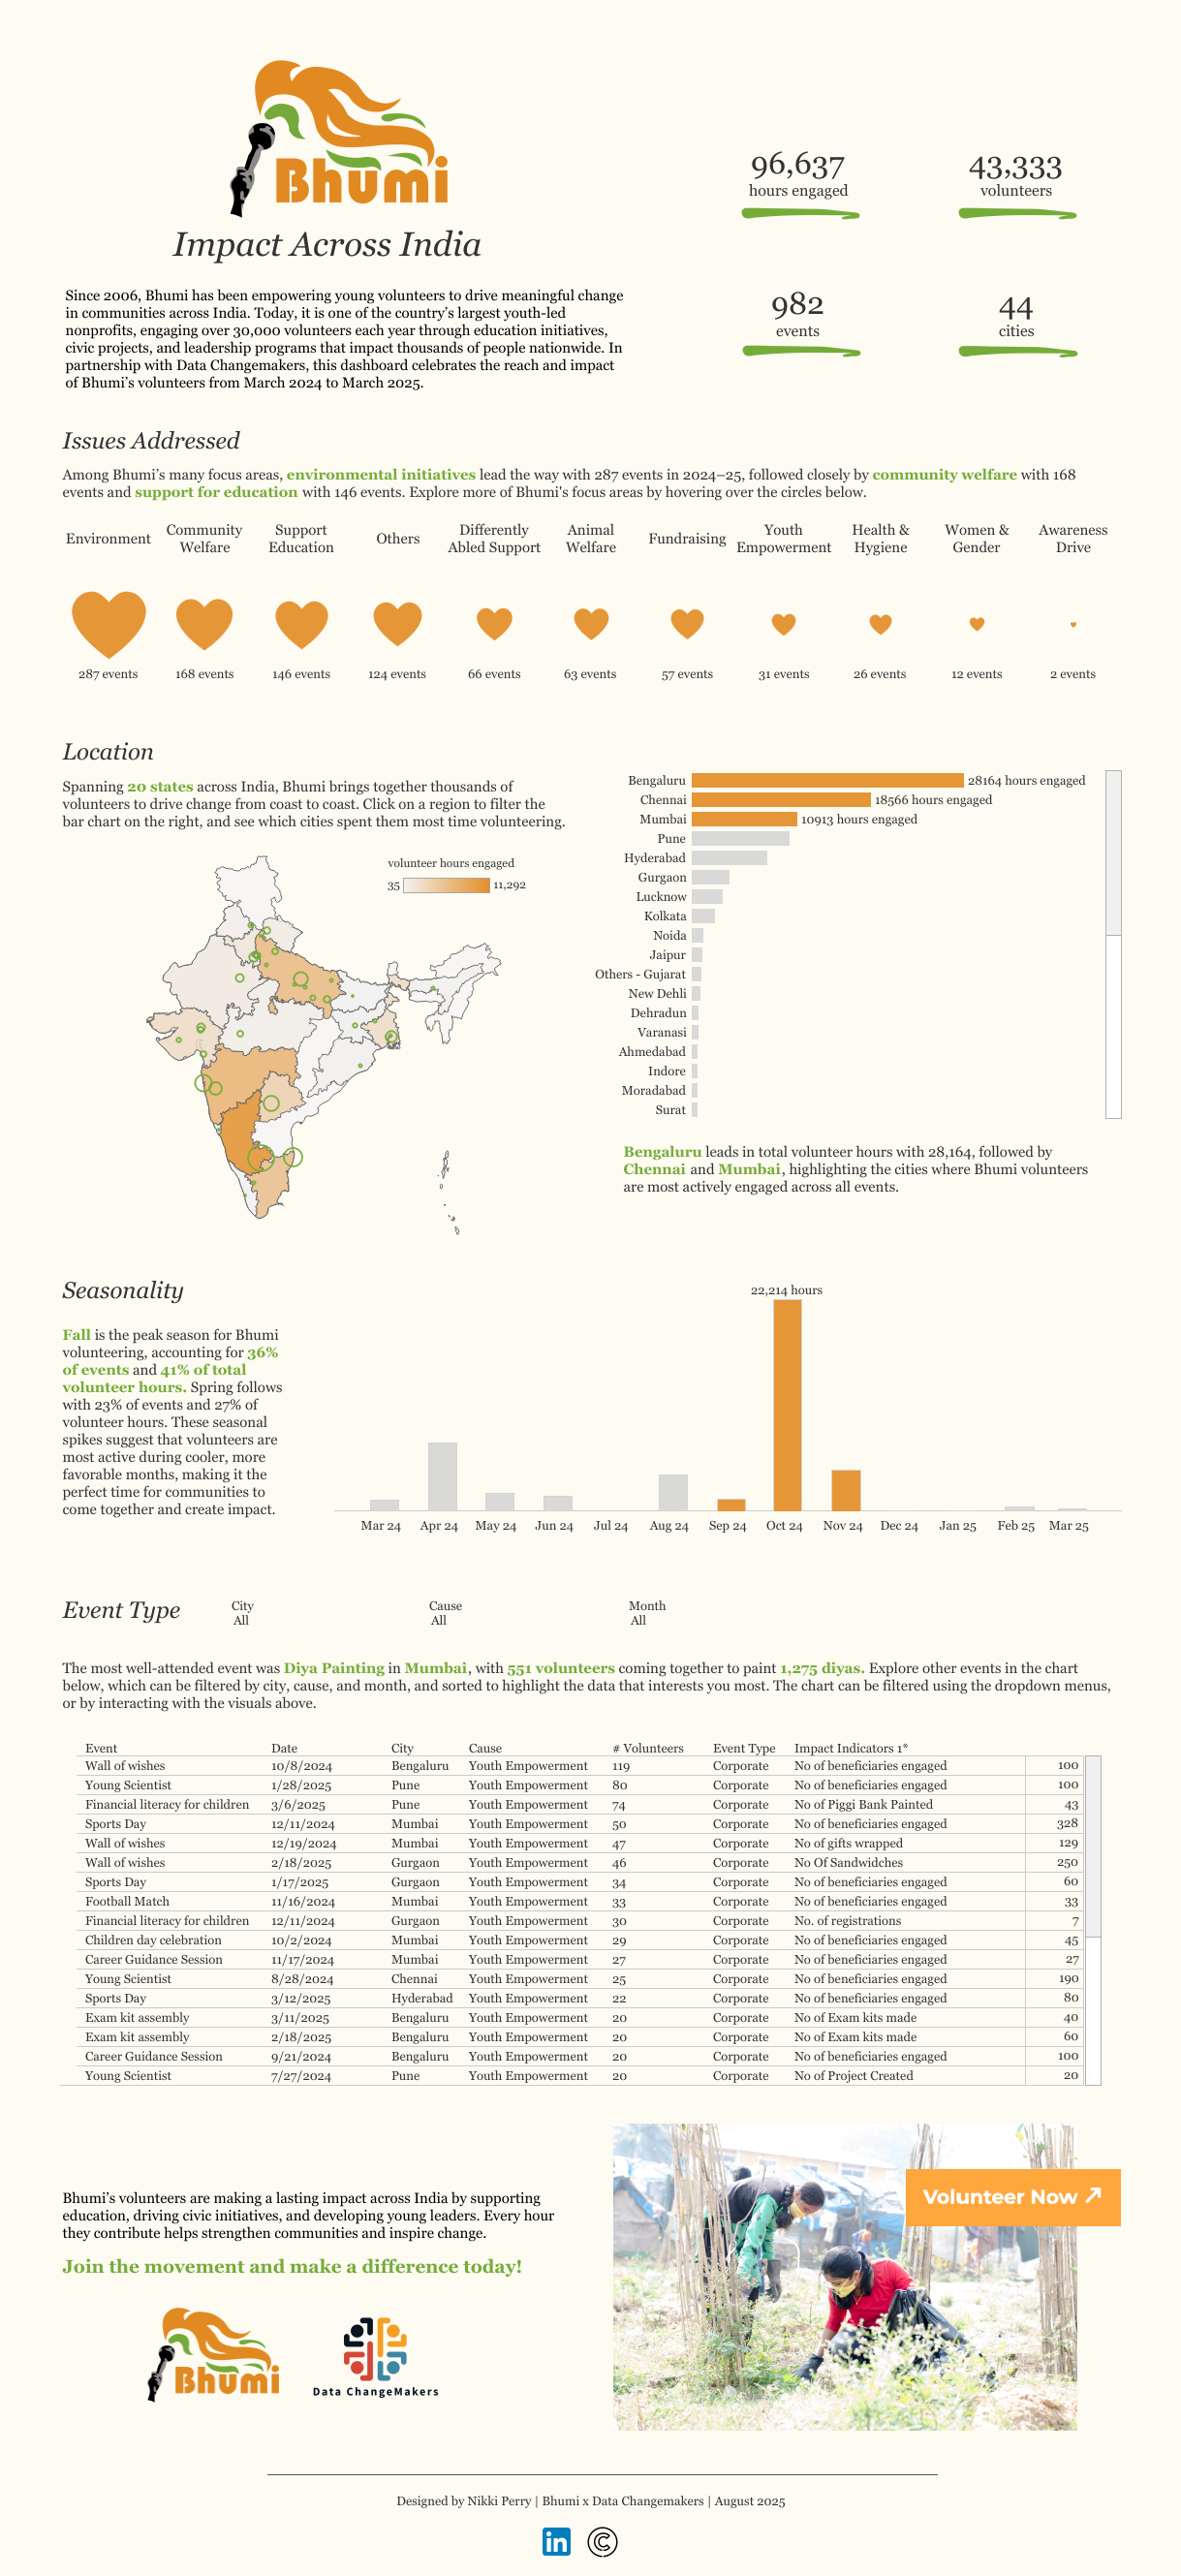
Impact Across India: Bhumi Volunteers
In partnership with Data Changemakers, this dashboard provides a clear view of Bhumi’s volunteer impact in India from March 2024 to March 2025, highlighting key issues, locations, seasonality, and event types.

The Global Landscape of Responsible AI
Created for the Global Index on Responsible AI’s GIRAIVIZ competition, this visualization presents an artistic interpretation of responsible AI across 19 thematic areas and 138 countries.

Who am I?

I’m Nikki, a data visualization and analytics specialist based in Washington, DC. I’m here to share my love for data with the world!
I’m passionate about data storytelling in all forms. I primarily work in Tableau, with experience in Python, Power BI, and R, and I’m actively learning how to create custom web-based visualizations using HTML and JavaScript.
With experience across the full data lifecycle—from capture and management to concise, thoughtful presentation—I specialize in extracting meaningful insights and finding the best ways to visualize them.
When I’m not nerding out online, you can find me playing single-player RPGs (currently discovering Skyrim 12 years late), trying out new recipes, or hanging out with my cat, Mr. Peanut.
Contact
Want to chat about data? Hire me? Send me cat videos? Grab my email or fill out the form and I'll get back to you ASAP!
All projects shared here are personal work, created independently and on my own time. They reflect my own interests and perspectives, not those of my current or past employers.
Nikki Perry | Updated February 2026